PowerScale におけるパフォーマンス確認方法について
ビッグデータ時代の到来により、企業のデータ量は飛躍的に増加しています。
運用における大きな課題はストレージの「パフォーマンスと運用管理」です。今回はPowerScale の標準機能で利用できる InsightIQとDataIQを使ったパフォーマンス確認手法を交え、性能限界値の捉え方をご紹介します。
運用における大きな課題はストレージの「パフォーマンスと運用管理」です。今回はPowerScale の標準機能で利用できる InsightIQとDataIQを使ったパフォーマンス確認手法を交え、性能限界値の捉え方をご紹介します。
1. PowerScale パフォーマンスの確認方法
InsightIQおよびDataIQで確認可能なパフォーマンス情報について、詳細を説明いたします。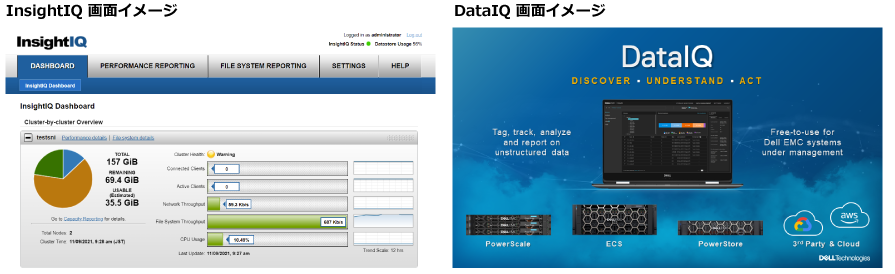
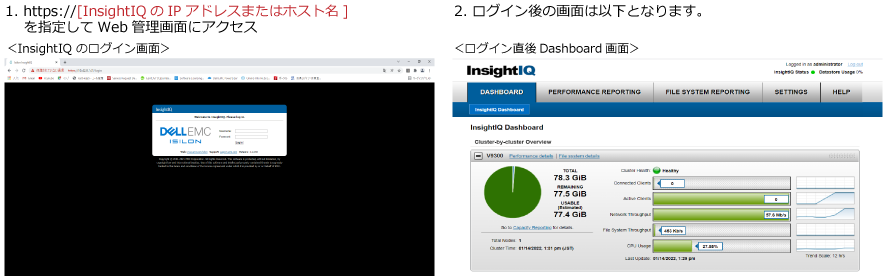
1-1. PowerScale パフォーマンスの確認方法-InsightIQ
該当クラスタ、Report Type, Date Rangeを選択し、[View Report]を押下することによりパフォーマンスを確認します。
- Report Type
- Cluster Performance
- Node Performance
- Network Performance
- Client Performance
- Disk Performance
- File System Cache Performance
- Date Range
パフォーマンスを確認する日時と範囲を選択
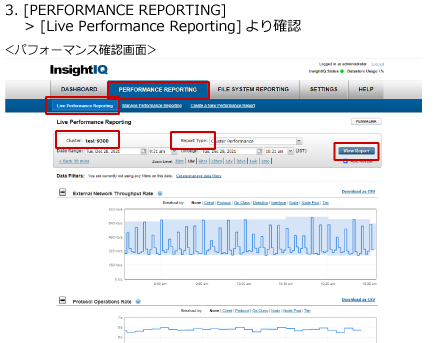
詳細は 1-3. PowerScale パフォーマンス情報:InsightIQ, DataIQ 以降で説明します。
1-2. PowerScale パフォーマンスの確認方法-DataIQ
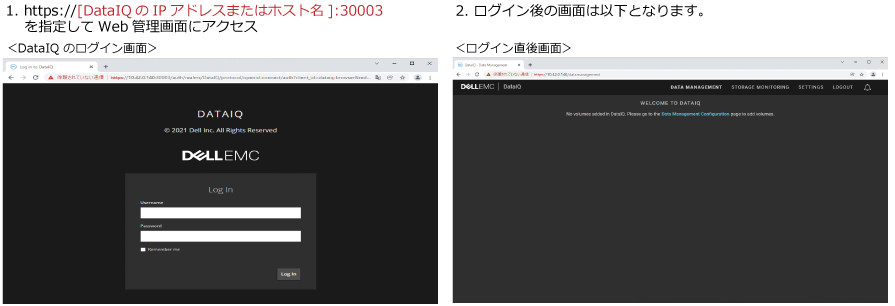
1-2. PowerScale パフォーマンスの確認方法-DataIQ
各Dashboard, Detailed reportsについての説明
Dashboard, Detailed reportsにはそれぞれ以下の項目があります。- Dashboards
- Capacity dashboard
- Client and user performance dashboard
- Cluster summary
- Data protection dashboard
- Data reduction dashboard
- File System dashboard
- Hardware dashboard
- Quota dashboard
- System dashboard
- Detailed reports
- Detailed capacity report
- Detailed file system report
- Detailed network performance report
- Detailed cluster performance report
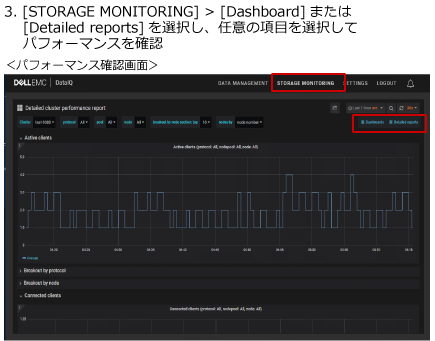
<パフォーマンス確認画面>では [Detailed reports] > [Detailed cluster performance report]の項目を選択しています。
1-3. PowerScale パフォーマンス情報:InsightIQ, DataIQ
InsightIQ, DataIQから確認できるパフォーマンス情報の詳細について説明します。InsightIQとDataIQにて確認可能な項目は同じですが、各項目において、表示方法が異なるため下記表をご確認ください。
| 項目 | 説明 | 確認可能なReport Type (Insight IQ) | 確認可能なReport, Dashboards (DataIQ) |
|---|---|---|---|
| Active Clients | PowerScaleに接続しているアクティブなクライアントの数 | ・Cluster Performance ・Node Performance |
Detailed reports ・Detailed cluster performance report |
| CPU % Use | CPU使用率 | ・Cluster Performance ・Node Performance |
Detailed reports ・Detailed cluster performance report |
| Disk Activity | Diskのbusy率 | ・Disk Performance | Dashboards ・Hardware dashboard |
| External Network Throughput Rate | 外部ネットワークへ通過したデータの合計量 | ・Cluster Performance ・Node Performance ・Network Performance ・Client Performance |
Detailed reports ・Detailed network performance report |
| Overall Cache Hit Rate | キャッシュからヒットを返したデータリクエストの割合 | ・File System Cache Performance | Detailed reports ・Detailed file system report |
| Protocol Operations Rate | クライアント毎のプロトコルのリクエストの総数 | ・Cluster Performance ・Node Performance ・Client Performance ・Disk Performance |
Detailed reports ・Detailed network performance report |
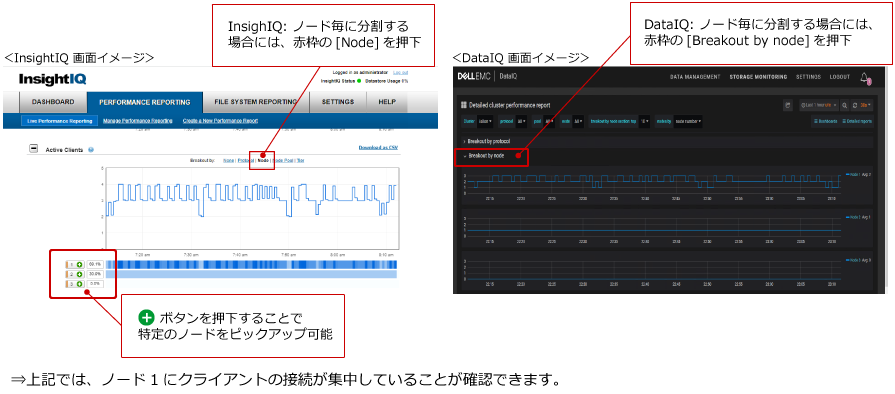
1-4. PowerScale パフォーマンス情報:Active clients
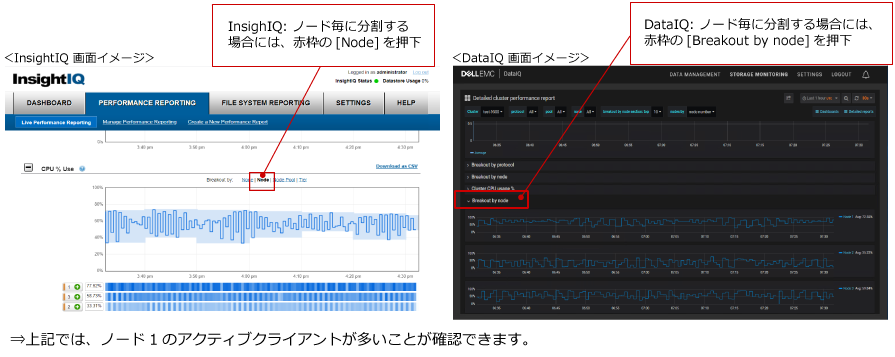
1-4. PowerScale パフォーマンス情報:CPU % use
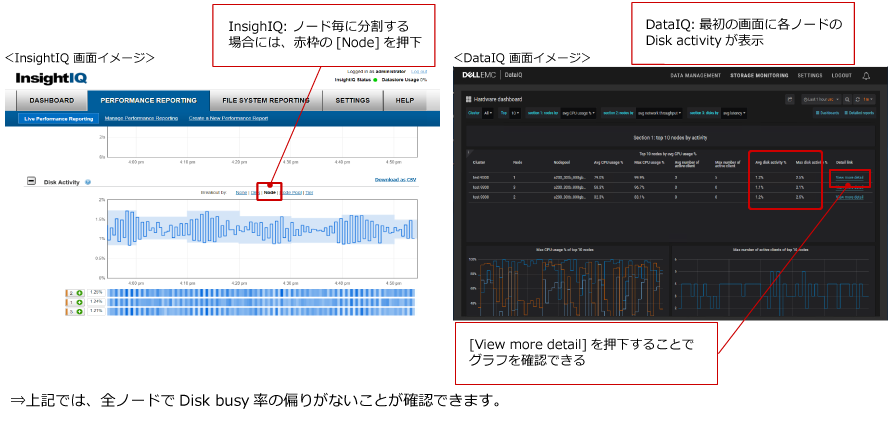
1-4. PowerScale パフォーマンス情報:Disk activity
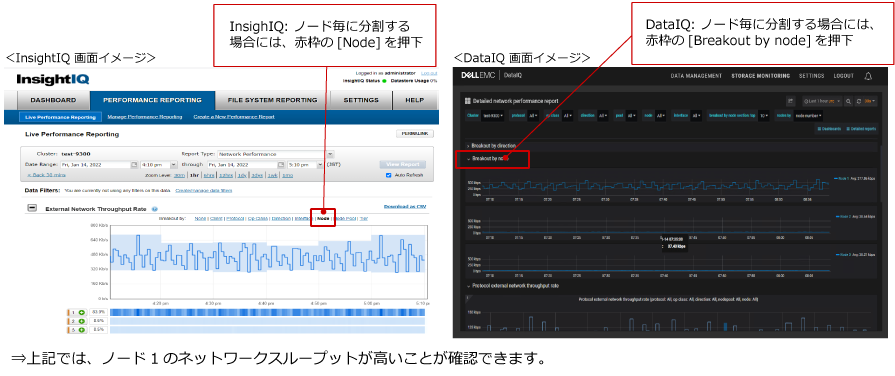
1-4. PowerScale パフォーマンス情報:External Network Throughput Rate
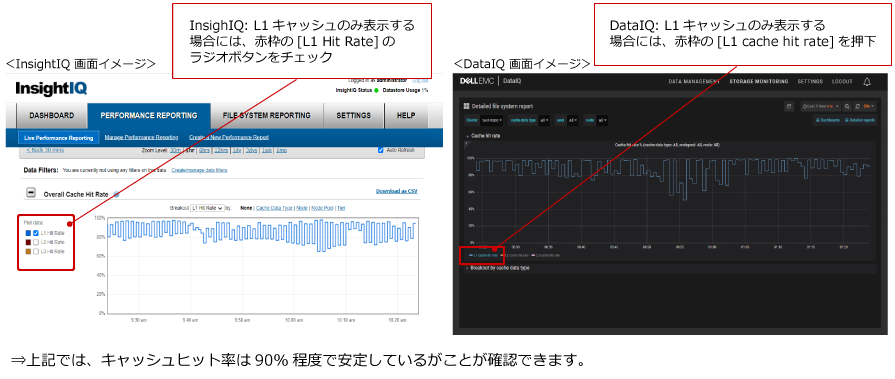
1-4. PowerScale パフォーマンス情報:Overall Cache Hit Rate
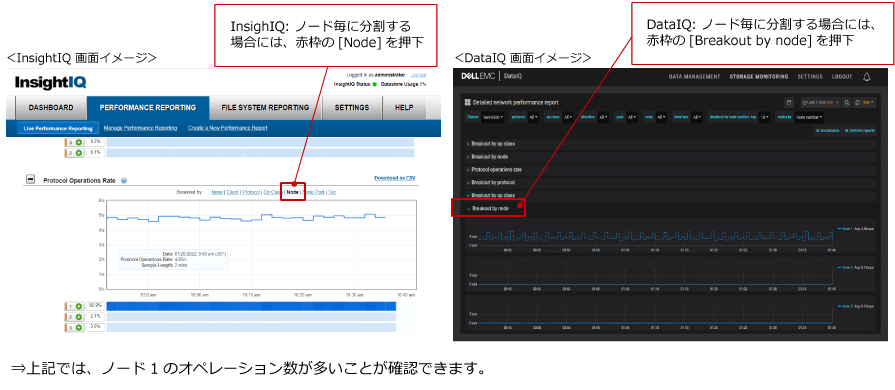
1-4. PowerScale パフォーマンス情報:Protocol Operations Rate
2.PowerScale パフォーマンス情報のサンプル
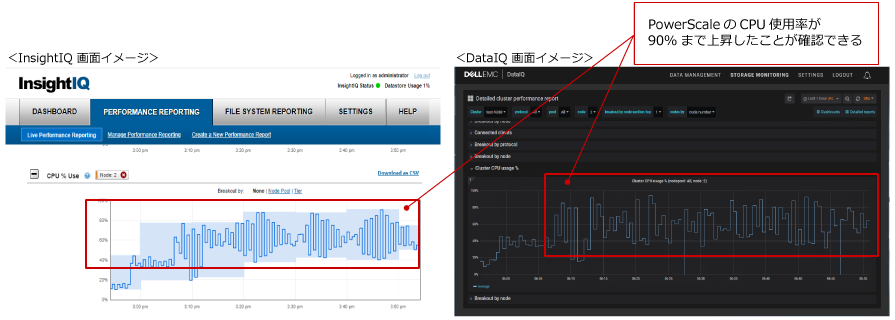
2-1. PowerScaleパフォーマンス情報のサンプル:CPU % use
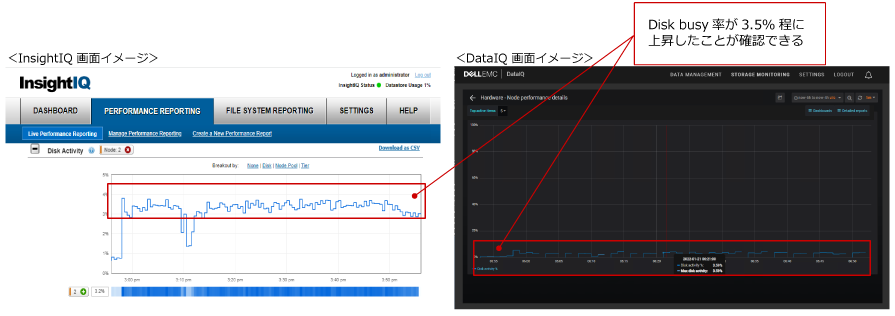
2-2. PowerScaleパフォーマンス情報のサンプル:Disk activity
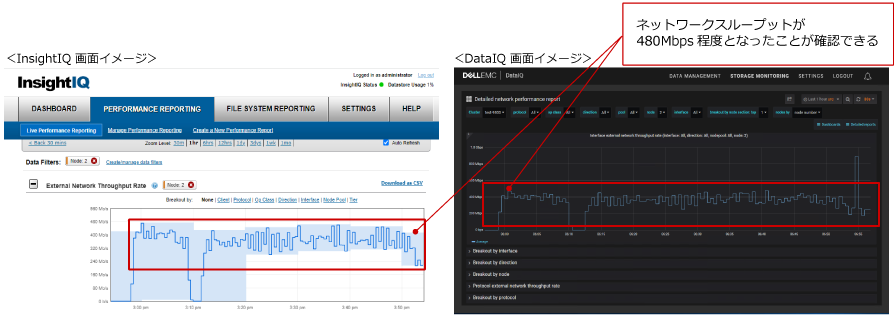
2-3. PowerScaleパフォーマンス情報のサンプル:External Network Throughput Rate
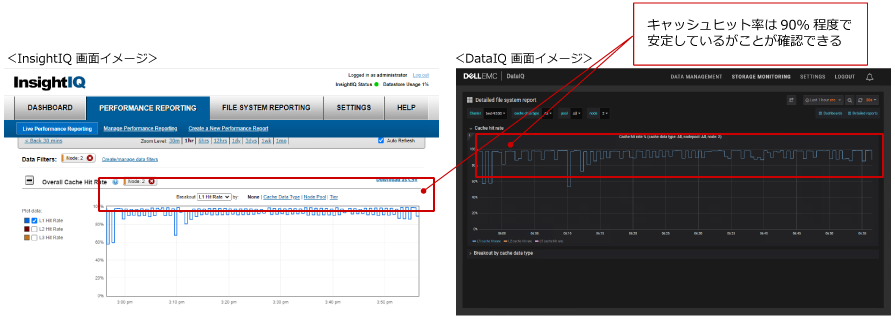
2-4. PowerScaleパフォーマンス情報のサンプル:Overall Cache Hit Rate
本テストにおける考察
- CPU % use : 最大 90%程度 ⇒100%に張り付いてはいないが、上限に近い。
- Disk activity: 最大 3.5%程度 ⇒100%の上限までは達していない。
- External Network Throughput Rate: 最大 480Mbps ⇒900Mbps (1Gbpsネットワークのバッファ込み)までは達していない。
- Overall Cache Hit Rate: 90%程度で安定 ⇒ヒット率の急低下とはなっていない。
| InsightIQ、 DataIQ にて パフォーマンス情報を分析することで、PowerScaleの性能限界を確認することが出来ます。特定の値のみではなく、総合的に判断する必要があります。 |
次回はストレージの負荷について、ストレージの応答が遅くなる要因について例を挙げ説明いたします。
PICK UP


Dell Technologies より Channel Services Delivery Excellence Award を受賞


イベント・セミナー
ニュース・キャンペーン
Dell EMC PowerScale (アイシロン)に
関するお問い合わせ
テクマトリックス株式会社
東京本社ネットワークセキュリティ事業部
第2営業部
プラットフォーム営業課03-4405-7816
テクマトリックス株式会社
西日本支店ネットワークセキュリティ営業課
06-6484-7486
- メールでのお問い合わせ
- storage-sales@techmatrix.co.jp